Private Equity Valuation Methods: Your Investor's Guide
19 June 2025
18 min read
Understanding Private Equity Valuation: Why It's Like Valuing a Mystery Box
Private equity valuation is a different beast than valuing a publicly traded company. Public companies offer readily available market data, regular financial reports, and analyst coverage – a wealth of information to guide your assessment. Private companies, on the other hand, are more like trying to figure out what’s inside a mystery box. You often work with limited financial information, projecting value over a 3-7 year holding period, and dealing with illiquid investments with no readily available market price. It's a blend of art and science.
Navigating the Unknown: The Need for Multiple Methods
Imagine trying to guess the value of a sealed box filled with various items. You might shake it, weigh it, even try to peek through any openings, but you won’t know for sure until you open it. Similarly, private equity professionals use a combination of valuation methods to get a better understanding of a company’s worth. Each method offers a unique perspective, like different senses working together.
Discounted Cash Flow (DCF) analysis: Projects future cash flows, much like imagining how a small plant inside the box might grow.
Comparable Company Analysis (CCA): Considers the value of similar businesses, as if comparing your mystery box to others that have already been opened and their contents revealed.
Leveraged Buyout (LBO) Modeling: Analyzes potential returns based on various financing structures. Think of it as estimating the box's resale value after you’ve improved its contents using borrowed money.
Asset-Based Approaches: Focus on the underlying value of the assets, similar to valuing each item inside the box individually. This becomes especially relevant when tangible assets like real estate or equipment are the primary value drivers. For a deeper understanding of financial statements, check out this deep dive into bank financial statements.
The Indian private equity market has its own unique nuances. Valuation methods like the Option Pricing Model (OPM), Current Value Estimation (CSE), and waterfall method are crucial in determining equity share value. These methods consider factors like the company's stage of development, growth potential, and performance.
For instance, in OPM and waterfall methods, senior securities are generally valued higher due to their preferential rights. However, the CSE method, which assumes all securities convert to common stock, can create discrepancies if the company's value drops. One company saw its valuation decrease from about 4.8 billion using this method. This emphasizes the importance of choosing the right valuation approach based on the company's growth stage and exit strategies. Learn more about the Indian PE market here.
The Art of Triangulation: Combining Insights for Accuracy
Relying on a single valuation method in private equity can be misleading. It’s like trying to understand a three-dimensional object by only looking at one side. Each method has its limitations. DCF, for instance, is sensitive to assumptions about future growth, while comparable company analysis may not fully capture the unique aspects of a particular business.
By combining these perspectives – triangulating the data – private equity professionals develop a more complete picture of a company’s intrinsic value. This approach reduces dependence on any single, potentially flawed viewpoint. Just as opening the mystery box reveals its true contents, using multiple valuation methods allows investors to unlock a more accurate and robust valuation of a private company.
DCF Analysis: Building Your Investment Crystal Ball
Imagine trying to predict the future. That's essentially what a Discounted Cash Flow (DCF) model aims to do for investments. It's a financial forecasting tool that uses projections of future cash flows, discount rates, and terminal values to estimate an investment's potential performance. But standard DCF models often fall short in the world of private equity. Why? Because they don't account for the active role PE firms play in reshaping their portfolio companies. Let's explore how professionals adapt DCF models for private equity valuation.
Projecting Free Cash Flows: Handling Uncertainty
The first piece of the puzzle is projecting free cash flows (FCF). Think of it as estimating how much cash a company will generate after covering its essential capital expenditures. In private equity, this projection needs to consider the operational improvements and strategic shifts the PE firm plans to implement. It's like predicting the growth of a young tree, knowing you'll be fertilizing it, pruning it, and maybe even grafting on new branches.
For instance, if a PE firm plans to boost a company's manufacturing capacity, the DCF model needs to reflect how that expansion will impact future revenue and expenses. Accurately forecasting these effects, especially 5-10 years out, can be a real challenge.
Determining Discount Rates: Reflecting Risk
Next, we have the discount rate, a crucial element that reflects the risk inherent in the investment. A higher discount rate signals higher risk, reducing the present value of those future cash flows. Private equity investments tend to be less liquid than publicly traded stocks, demanding a higher discount rate to compensate investors for this illiquidity. This is where adjusting the Weighted Average Cost of Capital (WACC) becomes vital, incorporating illiquidity premiums and company-specific risks.
Think of two identical saplings: one growing in a controlled greenhouse (public market) and the other exposed to the elements (private market). The outdoor sapling faces more uncertainties, justifying a higher discount rate. Similarly, private equity investments require higher discount rates. Effectively communicating this risk-adjusted return potential to investors is vital for securing funding, a skill explored in this guide on pitching investors.
Calculating Terminal Value: The Long View
The terminal value represents the investment's worth beyond the initial projection period. There are two main approaches to calculate this: the exit multiple method and the perpetuity growth model. The exit multiple method assumes the company will be sold at a multiple of its earnings at the end of the projection period. The perpetuity growth model, on the other hand, assumes a constant growth rate of cash flows continuing indefinitely.
Each method has its strengths. The exit multiple method is often favored when a clear exit strategy, such as an IPO or sale, is in sight. The perpetuity growth model is more suitable for companies expected to experience stable, long-term growth.
Before we delve further into the specifics of building a DCF model in private equity, let's look at a breakdown of the key components and considerations:
DCF Model Components and Key Considerations
A comprehensive breakdown of DCF model elements specific to private equity, including typical ranges and adjustments.
Component
Typical Range
PE-Specific Adjustments
Key Considerations
Revenue Growth
Varies widely by industry
Adjustments for operational improvements, new market entry, etc.
Realistic assumptions based on market analysis and due diligence
Profit Margins
Industry benchmarks and historical performance
Impact of cost-cutting initiatives and revenue enhancements
Sensitivity analysis to test various margin scenarios
Capital Expenditures
Historical data and future investment plans
Adjustments for expansion plans, equipment upgrades
Sensitivity analysis is crucial due to long-term nature
This table highlights the key elements of a DCF model in a private equity context. Notice how the PE-Specific Adjustments column emphasizes the active management approach inherent in private equity.
While a powerful tool, DCF analysis relies on assumptions about the future, which can be unpredictable. However, when used thoughtfully and alongside other valuation methods, it offers valuable insights into a private company's potential value.
Comparable Analysis: Finding Your Investment's Siblings
Imagine trying to figure out the value of a classic car. You wouldn't just guess. You'd look at similar cars – the same make and model, in similar condition, and see what they recently sold for. That’s the basic idea behind comparable analysis in private equity. Instead of cars, we're looking at companies. But there's a twist: your target company might change significantly while you own it.
Trading Comparables: Peeking at the Public Market
Trading comparables are publicly traded companies that resemble the one you’re valuing. Think of them like cars currently for sale on a dealer's lot. Their prices are readily available. We can use their market multiples, such as Price-to-Earnings (P/E) or Enterprise Value-to-EBITDA (EV/EBITDA), to get a benchmark for your target company.
Finding perfect matches is rare. You'll likely need to make adjustments. These adjustments account for differences in size, growth potential, and how much debt a company has. A smaller, faster-growing company might be worth a higher multiple than a bigger, slower-growing one.
Transaction Comparables: Learning From Recent Deals
Transaction comparables look at the prices paid in recent mergers and acquisitions (M&A) of similar companies. It’s like checking the "sold listings" to see what buyers actually paid. Transaction multiples often include a control premium. This premium reflects the added value of owning a controlling stake, and it can be hefty, often 20-30%.
Transaction comparables offer great insight, especially in private equity. Control is a major value driver in PE, and these comparables capture that. They also reflect premiums paid for synergies and how well a company fits into a buyer's strategy. These are important considerations for PE investors. The FCA's 2025 review of private market valuation practices emphasizes the need for robust valuations, given the inherent complexities and potential conflicts of interest.
Bridging the Comparability Gap: Handling Imperfect Matches
So, what happens when you can't find perfect matches? This is where the art of valuation comes in. You may have to tweak multiples based on things like the quality of the management team, market share, or the potential for operational improvements.
Another wrinkle is the liquidity discount. Private companies are harder to sell quickly than public companies. This reduced liquidity usually means applying a discount to the valuation you’d get from trading comparables.
Triangulating Value: Combining Insights For Accuracy
Seasoned valuation professionals rarely rely on just one method. They combine insights from trading and transaction comparables, tweaking for market conditions and factors specific to the company. They might even look at industry-specific metrics, like recurring revenue multiples for Software as a Service (SaaS) businesses.
For example, when valuing a private company in India, you might compare it to similar public companies listed on the NSE, considering factors like industry, growth prospects, and recent M&A activity. Looking at recent private placements or pre-IPO valuations of similar companies adds another layer of insight. This "triangulation" approach – combining multiple data points – provides a more reliable valuation range, leading to better investment decisions. It's about more than just filling in spreadsheet cells; it's about making informed investment choices.
LBO Modeling: Engineering Returns Through Smart Structure
undefined
Leveraged Buyout (LBO) modeling isn't just about plugging numbers into a spreadsheet. It's about strategically designing returns. Think of it as building a powerful financial engine, where debt acts like a lever, amplifying potential profits and driving operational efficiency. It combines the potential of improved operations, increased market valuation, and the smart use of borrowed money.
Building the Machine: Modeling Debt's Impact
At its heart, LBO modeling involves creating a financial model that simulates a private equity firm’s investment in a company using borrowed capital. This model is a crucial tool, acting both as a valuation method and a roadmap for structuring the deal. It lets PE professionals explore different financing options, from standard bank loans to more complex mezzanine financing, and see how each affects potential returns and the associated risks. This detailed approach is quite different from simpler methods like asset-based valuations, which are used when a company’s individual assets are more valuable than the company as a whole.
For example, imagine a PE firm modeling a deal with 70% senior debt and 30% equity. The model would then project how the company's cash flow will handle debt repayments, cover operational expenses, and ultimately generate profit for the investors.
The Mechanics of Modeling: Debt Structures and Returns
Different debt structures come with different levels of risk and potential reward. Senior debt is typically less expensive but comes with stricter conditions (covenants), while mezzanine financing is pricier but offers more flexibility. LBO models help PE professionals weigh the pros and cons of these options.
Think of it like two levers on our financial engine. One is shorter (senior debt), easier to pull, but generates less movement. The other is longer (mezzanine financing), harder to pull, but generates more movement. LBO models simulate pulling different combinations of these levers to find the best balance for returns. This detailed financial analysis aligns with the increasing focus on rigorous valuation in private markets.
Modeling Beyond Debt: Rollover Equity and Recapitalizations
LBO models go beyond just debt structures. They also factor in other important elements that influence valuation and returns. One example is management rollover equity, where existing management invests alongside the PE firm. This aligns everyone's interests and encourages performance improvements.
Another key component is dividend recapitalization. This involves taking on additional debt later in the investment to pay dividends to investors. This effectively returns capital earlier, boosting the internal rate of return (IRR).
Sensitivity Analysis: Identifying Key Drivers
Finally, LBO models often include sensitivity analysis. This lets PE professionals test how changes in various assumptions – such as revenue growth, profit margins, or exit multiples – affect the outcome. Identifying the key drivers of return – is it the market valuing the company higher, growth in profits, or paying down debt? – helps guide strategies for creating value.
It’s like adjusting the dials on our financial engine. Sensitivity analysis shows which dials have the biggest impact on performance. Is it the fuel efficiency dial (profit growth) or the speed dial (market valuation)? This active approach to valuation contrasts with more static methods like net asset value calculations often used for asset-heavy businesses.
LBO models are dynamic tools. They evolve from initial screening tools to detailed operational roadmaps, guiding value creation throughout the investment’s lifecycle. They are essential for any PE professional looking to generate returns through smart deal structuring and operational improvements. In rapidly growing markets, LBO models are especially important for structuring deals in expanding sectors. This analytical rigor is essential in today’s environment of increasing regulatory oversight.
To help visualize the breakdown of LBO returns, let’s look at a table summarizing typical contributions:
LBO Return Drivers and Impact Analysis
Return Driver
Typical Contribution
Risk Level
Control Factor
EBITDA Growth
40-60%
Moderate
High
Multiple Expansion
20-40%
High
Medium
Debt Paydown
10-20%
Low
High
Margin Improvement
5-15%
Moderate
High
This table shows how different factors typically contribute to returns in LBO transactions and highlights the relationship between risk and control. While increasing market valuation can significantly boost returns, it’s riskier than profit growth or debt reduction, which are directly influenced by improvements in operations. Understanding these drivers is essential for effective LBO modeling and sound investment decisions.
Asset-Based Approaches: When the Parts Tell the Story
Sometimes, the sum of a company's parts is worth more than the whole. Imagine dismantling a classic car – occasionally, the individual components, like the engine or vintage steering wheel, fetch a higher price than the entire vehicle. This is the essence of asset-based valuation in private equity.
This approach is especially relevant for companies with significant physical assets, businesses facing financial distress, or those holding valuable non-operating assets that traditional cash flow analysis might overlook. It's about digging deep into balance sheets and appraisals to uncover hidden gems.
Net Asset Value: Taking Stock
Net Asset Value (NAV) is a cornerstone of asset-based valuation. Think of it like taking inventory of a shop: you add up the current market value of everything on the shelves and then subtract any outstanding loans or debts. That's NAV.
This method is particularly useful when a company owns substantial tangible assets, such as real estate or specialized equipment. For instance, a manufacturing company might own a factory on prime real estate, the true value of which isn't fully reflected in its earnings. NAV helps capture this hidden value. However, accurately assessing "fair market value" often requires professional appraisals.
Adjusted Book Value: A Reality Check
Adjusted Book Value starts with the company's book value (assets minus liabilities from the balance sheet) but then updates it to reflect current market conditions. It's like revising an old price list to match today's prices.
This process involves scrutinizing each asset and liability. A company's outdated equipment might be written down to its actual resale value, while a valuable patent might be revalued upwards based on recent market transactions. This careful adjustment often reveals a more accurate picture of a company's financial health.
Liquidation Analysis: The Bottom Line
Liquidation analysis asks a tough question: "What if we had to sell everything tomorrow?" It estimates the value of a company if its assets were sold off piecemeal in a quick sale – imagine a fire sale at a retail store.
This "break-up" value isn't the primary valuation method for most private equity deals, but it provides a critical benchmark, especially when assessing downside risk. It becomes particularly important when evaluating companies facing financial difficulties or considering worst-case scenarios.
Uncovering Hidden Value and Risks
Asset-based approaches also involve looking beyond the obvious – at intangible assets and off-balance sheet liabilities. Intangible assets, like a strong brand reputation or proprietary technology, can be incredibly valuable but don't always appear on the balance sheet.
Similarly, off-balance sheet liabilities, like operating leases or pending lawsuits, can significantly impact a company's true worth. Identifying these hidden factors is crucial for a complete understanding of a company's financial standing. Think of it as due diligence detective work.
A Holistic View
Asset-based approaches rarely stand alone. They often complement other private equity valuation methods, especially when operational restructuring or strategic asset sales are on the horizon. Consider the impact of Capital Gains Tax (CGT) when selling assets, as this can greatly influence the final net value. By combining asset-based methods with other techniques, investors gain a more comprehensive understanding of a company's value, leading to better-informed decisions. This multi-faceted approach, echoing the spirit of regulatory reviews focused on market transparency, promotes greater confidence in private equity investments.
Industry-Specific Methods and Special Situations
Just as a doctor uses different tools to diagnose different ailments, private equity investors use a variety of valuation techniques depending on the target company's industry and specific circumstances. A software startup, a pharmaceutical giant, and a traditional manufacturer each require unique approaches.
Sector-Specific Nuances: Adapting Your Toolkit
Standard valuation methods often need adjustments to accurately reflect the unique characteristics of different industries. Imagine valuing a tech company with minimal physical assets but a groundbreaking software platform. Here, intangible assets and future growth potential take center stage. A Discounted Cash Flow (DCF) analysis might be appropriate, but you'd need to carefully project future revenue streams.
On the other hand, valuing a manufacturer with substantial factories and equipment might lean more on asset-based approaches like replacement cost analysis. Healthcare companies present another challenge altogether, with regulatory hurdles and long drug development timelines demanding adjustments to traditional DCF models. Consider, too, regional differences. India's private equity market, accounting for roughly 20% of Asia-Pacific investments in 2023, demonstrates the need to adapt methods to local market conditions. This rapid growth, fueled by a robust economy and increasing digital adoption, underscores the importance of tailored valuation approaches. To learn more about Asian private equity, explore insights from Morgan Stanley.
Specialized Metrics: Beyond the Basics
Different sectors also demand specialized metrics. While traditional earnings multiples might be suitable for established industries, software companies are often evaluated using recurring revenue multiples. In real estate, metrics like net operating income (NOI) and capitalization rates are key. Understanding these sector-specific metrics is crucial for accurate valuations.
Navigating Special Situations: Distressed Assets and High-Growth Companies
Special situations, such as distressed companies or high-growth ventures, require further adjustments. When assessing a distressed company, liquidation values and restructuring scenarios become central to the analysis. You also need to consider tax implications on any asset sales, such as Capital Gains Tax (CGT). For high-growth companies, conventional metrics might underestimate future potential, necessitating adjustments to growth rates and discount rates.
Adapting to Unique Circumstances
Seasoned private equity professionals adapt their valuation toolkit to each opportunity, much like a chef selects different knives for different ingredients. They tailor their approach to the specific characteristics and risks of each investment. For instance, valuing a cyclical business, where performance swings with economic cycles, requires careful timing and consideration of market conditions. Understanding these cyclical patterns is essential for informed decision-making.
By combining industry expertise, relevant metrics, and careful adaptation of core valuation methods, experienced investors ensure their analyses capture the true value drivers of each investment. This tailored approach is vital for success, especially in complex and dynamic markets. By recognizing the unique nuances of each opportunity, they can uncover hidden value and mitigate potential risks.
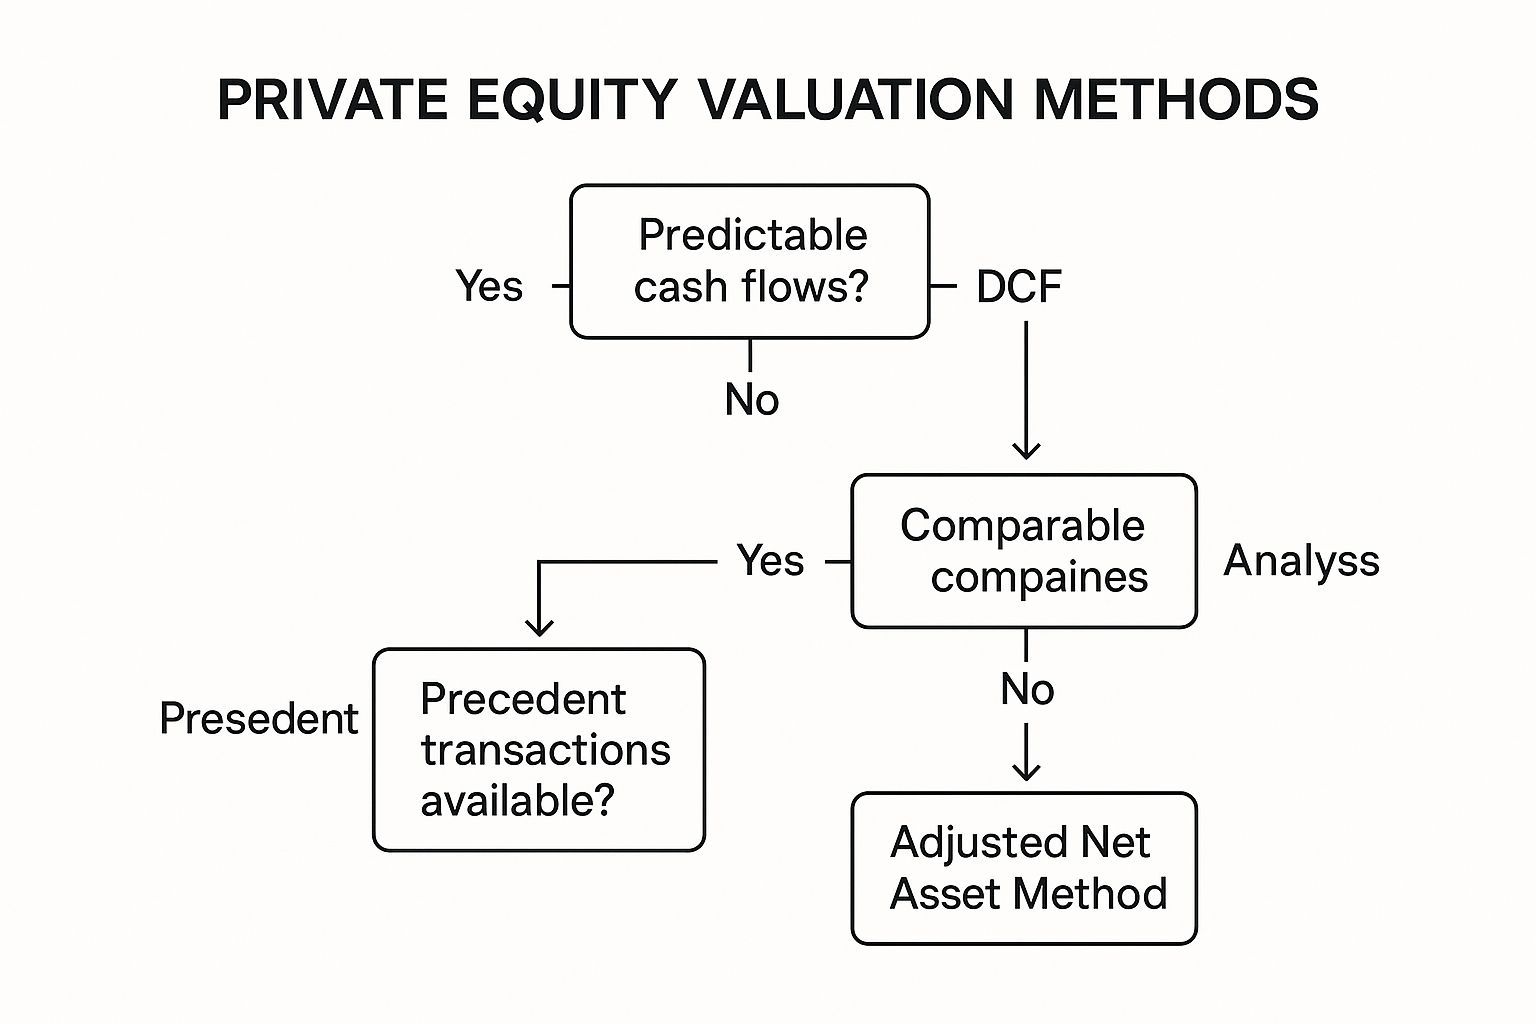
Your Strategic Decision Framework: Choosing the Right Method
The infographic above gives you a simple roadmap for picking the right private equity valuation method. Think of it as a choose-your-own-adventure for valuation, starting with how predictable a company’s cash flows are. Predictable? DCF analysis might be your best bet. Not so predictable? Other methods like Comparable Company Analysis, Precedent Transactions, or Adjusted Net Asset Value could be more suitable. The key takeaway here is that every company is unique, so your valuation approach should be too.
Picking the right private equity valuation method is essential for making smart investment choices. It's not about finding the one perfect method, but rather understanding which ones to prioritize based on the specific circumstances. This means weighing different approaches, spotting potential problems, and weaving multiple analyses together to form a solid investment thesis. For a mature company with steady cash flows, a Discounted Cash Flow (DCF) analysis might be a good fit. But for a young startup with little operating history, a comparables analysis, looking at the valuations of similar companies, might be more insightful.
Weighing Methods Appropriately: Context Is Key
Just like you wouldn't use a hammer to fix a leaky faucet, you need the right valuation tools for each stage of the investment lifecycle. Early on, during initial screening, quick checks using multiples or precedent transactions can help you narrow down your options. As you move into due diligence, a more detailed DCF model, with comprehensive financial projections and sensitivity analyses, becomes critical. Finally, when planning your exit, understanding market conditions and current transaction multiples becomes paramount.
The growing sophistication of the Indian private equity market underscores the need for advanced valuation strategies. The surge in exits, hitting $24.8 billion with a 36% increase in 2023, shows just how important accurate valuations are, especially as the market moves towards more control and buyout deals. Learn more about the Indian PE market here.
Understanding the potential downsides of each method is just as important as knowing its strengths. A DCF analysis, for instance, can be very sensitive to growth assumptions, resulting in vastly different valuations based on small tweaks to projections. Comparables can be misleading if the peer group isn't truly comparable or if market conditions have changed dramatically. Asset-based approaches might undervalue companies with significant growth potential or valuable intangible assets. It’s important to be mindful of these potential traps.
Triangulating for Confidence: The Power of Multiple Perspectives
The strongest valuations often come from combining multiple methods. This "triangulation" approach gives you a range of possible values and helps confirm your assumptions. Let's say your DCF analysis suggests a high valuation, but comparable transactions point to a lower range. That difference is a red flag, telling you to dig deeper. Maybe your growth assumptions are too optimistic, or perhaps there are unique factors influencing the comparables. This cross-checking process is key to building confidence in your analysis.
To explore a diverse range of unlisted share options and make informed investment decisions, visit Unlisted Shares India.
Share:
Our Blogs
Our blog provides insightful information about unlisted shares, offering a deeper understanding of how these assets work, their potential benefits, and the risks involved. Whether you're new to unlisted shares or looking to expand your knowledge, we cover topics such as investment strategies, valuation methods, market trends, and regulatory aspects. Stay updated with expert tips and guides to navigate the unlisted share market effectively.