When you're trying to figure out which Indian stocks to invest in for the long haul, you need a solid game plan. That's where fundamental analysis comes in. Think of yourself as a business detective. Your job isn't to get caught up in the daily noise of stock price ups and downs; it's to look past all that and figure out what a company is truly worth.
Why Fundamental Analysis is Your Compass in the Indian Market
The Indian stock market can feel a lot like navigating a vibrant, chaotic bazaar. There are incredible opportunities everywhere, but the complexity can be overwhelming. To find your way, you need a reliable compass, and that's exactly what fundamental analysis provides. It forces you to evaluate a business on its actual substance, not just its popularity contest in the market.
Instead of chasing a stock's fluctuating price, you learn to uncover its intrinsic value. This is the real, underlying worth of a company, based on its performance, assets, and future potential. It’s like buying a house: you wouldn't just look at the fresh coat of paint; you'd inspect the foundation and the quality of the construction. For anyone just starting out, getting to grips with fundamental analysis for beginners is the perfect first step.
This approach is more important than ever in a market like India's, which is known for both exciting growth and sometimes steep valuations. Take the SENSEX, for instance. It delivered a return of roughly 9.94% over the past year, a testament to the market's resilience. But when the whole market is rising, it's easy to overpay. That’s why you have to dig deeper and find genuinely undervalued companies, not just ride a broad market trend.
Fundamental Analysis vs Technical Analysis at a Glance
To really get why fundamental analysis is so powerful, it helps to see how it stacks up against its counterpart, technical analysis. While both aim to make profitable investment decisions, they go about it in completely different ways.
Aspect
Fundamental Analysis (The 'Why')
Technical Analysis (The 'When')
Core Focus
A company's financial health, industry position, and economic conditions to find its true value.
Past price movements, chart patterns, and trading volumes to predict future price trends.
Time Horizon
Long-term investing (months to years).
Short to medium-term trading (days to weeks).
Goal
To buy great companies at a discount to their intrinsic value.
To identify optimal entry and exit points based on market sentiment and momentum.
Key Tools
Financial statements (P&L, Balance Sheet), cash flow statements, industry analysis, and economic reports.
"When is the right time to buy or sell this stock?"
As you can see, fundamental analysis is about the 'why'—understanding the business itself. Technical analysis is about the 'when'—timing your trades. Many successful investors use a blend of both, but a solid foundation always starts with the fundamentals.
From Theory to Practice
This guide is designed to take you from theory to practical application, helping you learn to read a company's financial story. Mastering these core principles is a cornerstone of successful stock market investing and will give you the confidence to make smarter decisions.
We'll break it all down, covering:
Financial Health: How to read a company's "report card"—its financial statements.
Key Ratios: Using powerful metrics to compare companies apples-to-apples.
Valuation Methods: Practical techniques for estimating a stock's fair price.
Qualitative Factors: The art of looking beyond the numbers at leadership, brand power, and competitive advantages.
Understanding a Company's Financial Health
Before you can even begin to do a fundamental analysis of Indian stocks, you need to know how to peek under the bonnet and check the engine. It's like giving a business a full health check-up. We're not just glancing at the daily share price, which bounces around with market moods. Instead, we’re digging deep to see how strong the company really is.
The best place to start this financial check-up is with the company's three core financial statements. These aren't just numbers; they're the official story of a company's performance and financial standing.
Profit and Loss (P&L) Statement: Think of this as the company's yearly report card. It tells you exactly how much money came in (revenue) and how much went out (expenses) over a specific period, showing whether it made a profit or a loss.
Balance Sheet: This is a snapshot of the company's net worth on a single day. It carefully lists everything the company owns (assets) and everything it owes (liabilities), giving you a clear picture of its financial structure.
Cash Flow Statement: This is like reviewing a company's bank account statement. It shows all the cash moving in and out from its core operations, investments, and financing activities. It reveals how good the company is at actually generating and handling hard cash.
The P&L statement tells a powerful story about a company's journey over time. When you break it down, you're searching for consistent growth and healthy profit margins. Two figures are absolutely critical here: revenue growth, which tells you if the business is actually growing, and the net profit margin, which shows how much profit it squeezes out of every rupee of sales.
A business with steadily climbing revenue and strong, stable profit margins is usually a good sign. It points to a healthy, well-managed operation. Conversely, falling revenues or shrinking margins should set off alarm bells.
Interpreting the Balance Sheet
The Balance Sheet offers a window into a company's ability to weather financial storms. One of the first things I always check is the debt level. High debt isn’t automatically a deal-breaker, particularly for a company in a high-growth phase, but it absolutely must be manageable.
As you get comfortable assessing a company's finances, you also need to grasp the bigger picture of Managing Investment Risk, because a shaky balance sheet is a massive risk. For a real-world look, you can dive into the detailed financial reports of HDB Financial Services to see exactly how these numbers are laid out.
Once you can confidently read these documents, you're no longer just scratching the surface. You're starting to truly understand what makes a company tick.
Using Key Ratios to Analyse Indian Stocks
If financial statements are the raw ingredients, then financial ratios are the recipe that turns that data into an understandable meal. When it comes to the fundamental analysis of Indian stocks, these ratios are your sharpest tools. They let you compare one company against another on a level playing field, helping you answer critical questions quickly.
Think about it this way: knowing a company made a profit of ₹100 crores is one thing. But knowing it made that profit using only ₹500 crores of shareholder money? That’s a game-changer. This is the real power of ratios—they add crucial context to the numbers. Let’s dive into the ones that matter most.
Profitability And Valuation Ratios
These ratios cut straight to the chase, telling you how good a company is at making money and how the market currently feels about it. For most analysts, this is the first port of call.
Price-to-Earnings (P/E) Ratio: This is probably the most famous ratio out there. It tells you exactly how much you're paying for every rupee of a company's earnings. A high P/E might suggest a stock is expensive, while a low P/E could signal it’s a potential bargain.
Return on Equity (ROE): From a shareholder's perspective, this is the ultimate measure of profitability. ROE reveals how effectively management is using your capital to generate profits. An ROE of 15% or more is often the hallmark of a strong, well-run business.
Price-to-Book (P/B) Ratio: This ratio compares the company's market price to its book value (which is simply its assets minus liabilities). It’s especially useful for valuing companies in capital-heavy sectors like banking and manufacturing, where physical assets are the core of the business.
These ratios are all about financial stability and survival. A profitable company that's drowning in debt can be a very risky bet, which makes these checks absolutely non-negotiable.
The Indian market context is vital here. For years, large-cap stocks were the only game in town, with their concentration in the NIFTY 50 hitting as high as 77% back in 2013. That figure has since dropped to around 60%, showing the rising influence of mid and small-cap companies. These smaller firms might have explosive growth potential (and thus higher valuations), but they often carry more debt, making a thorough D/E analysis even more critical.
Getting a handle on these ratios is a core skill, but it's just one piece of the puzzle. To truly understand a company's total worth, you need to go deeper. The methods used for a full private company valuation offer incredible insights into how intrinsic value is calculated from the ground up. By combining sharp ratio analysis with these broader valuation techniques, you start building a much more complete and reliable picture of any potential investment.
Valuation Methods: Finding a Stock's Fair Price
Once you’ve dug into a company’s financial health and scrutinised its key ratios, it’s time for the big question: what is this business actually worth? This is where valuation comes in. It’s the process of connecting all your research to a single, tangible price to determine if a stock is a bargain, fairly priced, or dangerously overvalued.
Two core methods form the bedrock of valuation in the investment world: Discounted Cash Flow (DCF) and Relative Valuation. They might sound a bit academic, but the ideas behind them are surprisingly straightforward.
Discounted Cash Flow (DCF)
Let’s use an analogy. Imagine you’re buying a small shop that generates rental income. You wouldn’t just pay the asking price; you'd think about all the rent you expect to collect over the next 10 or 20 years. Then, you'd figure out what that future stream of cash is worth to you today.
That's precisely what a DCF analysis does for a company. It forecasts all the cash a business is likely to produce in the future and then uses a 'discount rate' to translate that future money back into a single value in today's terms. It’s an attempt to find a company's true intrinsic worth based purely on its own ability to generate cash, ignoring the market's current mood swings.
Relative Valuation
This approach is much more like shopping for a house on a specific street. You'd naturally look at what similar houses in the same neighbourhood have recently sold for. Relative valuation applies this exact logic to the stock market.
Here, you use popular ratios like the Price-to-Earnings (P/E) or Price-to-Book (P/B) ratio to see how a company stacks up against its direct competitors or even its own historical performance. For instance, if Company A has a P/E ratio of 15 while its industry peers are all trading at an average P/E of 25, it could be a strong signal that Company A is relatively cheap. It's a quick, grounded-in-reality way to see how the market is pricing one company against another.
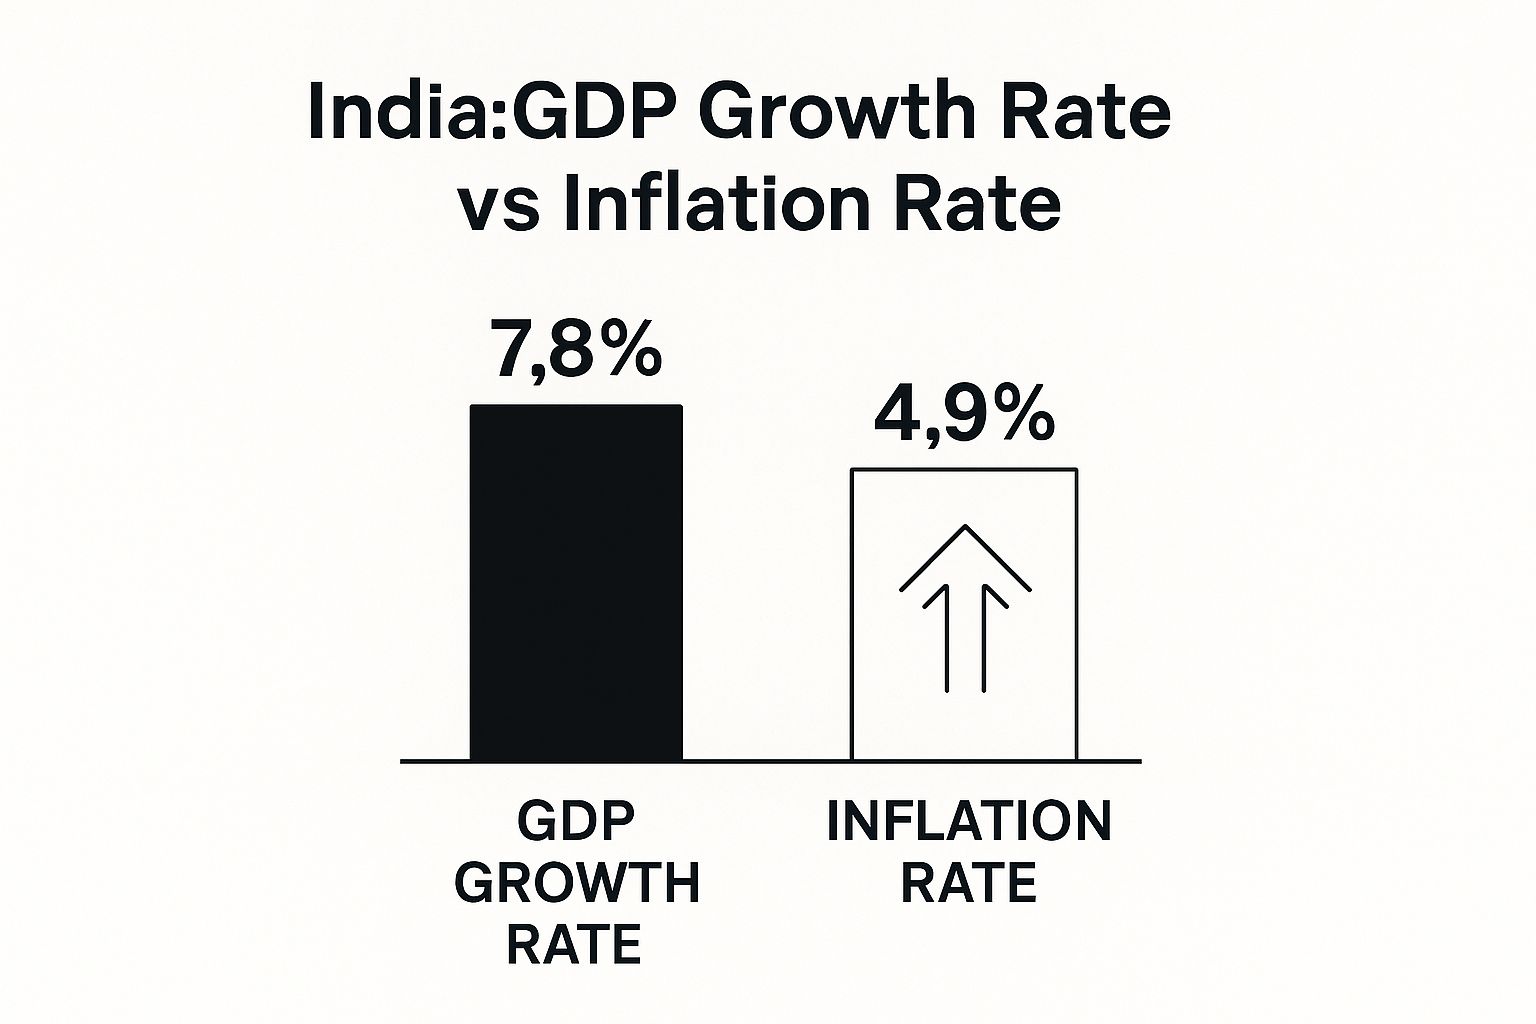
The infographic below shows how India's GDP growth and inflation rates—two major macroeconomic forces—interact. These factors are critical because they directly impact a company's future earnings and the discount rates used in valuation models.
As you can see, periods of strong economic growth in India often come with rising inflation. A smart investor has to account for this dynamic when trying to predict a company’s future and determine its present value.
Comparing Valuation Methods
To make sense of these different approaches, it helps to see them side-by-side. Each method has its own logic and is best suited for different situations.
Valuation Method
Core Concept
Best For
Discounted Cash Flow (DCF)
A company's value is the sum of all its future cash flows, discounted back to today.
Valuing stable, predictable businesses with a long history of generating cash (e.g., established FMCG or IT companies).
Relative Valuation (P/E, P/B)
A company's value is determined by comparing it to similar companies in the same sector.
Quick comparisons and valuing companies in sectors with many publicly listed peers (e.g., banking, auto).
Ultimately, no single method is foolproof. The most robust analysis will use both. Think of it this way: DCF helps you determine what a company should be worth in a perfect world, while relative valuation tells you what the market is willing to pay for similar companies right now.
For those curious about how these valuation principles are applied beyond the public stock market, exploring private equity valuation methods can offer even deeper insights. By getting comfortable with these techniques, you move beyond just analysing a business and start making confident judgements on what its shares are truly worth.
Looking Beyond the Numbers in the Indian Market
While spreadsheets and financial reports tell you part of a company's story, they don't tell you the whole story. Some of the most critical factors driving a business's success can't be neatly quantified on a balance sheet. This is where qualitative analysis comes into play—an essential piece of the puzzle for a complete fundamental analysis of Indian stocks.
Think of it as judging the character of a business. A company with fantastic numbers but questionable management is a massive red flag. The real art of investing is weaving together the hard data with these less tangible, but equally crucial, insights.
Evaluating Management Quality
A company is ultimately a reflection of the people at the helm. This is especially true in India, where many businesses are still promoter-driven. When you invest, you aren't just buying a piece of the company; you're placing your trust in the management team's vision and ability to execute.
So, what should you look for?
Integrity and Transparency: How does the leadership team communicate, particularly when things go wrong? A track record of honest, straightforward communication with shareholders is worth its weight in gold.
A Clear Vision: Do the leaders have a coherent, long-term strategy? Dig into their annual reports and listen to investor conference calls to understand their strategic thinking.
Smart Capital Allocation: What does the company do with its profits? Disciplined leaders will either reinvest capital wisely to fuel future growth or return surplus cash to shareholders.
Warren Buffett famously popularised the concept of an "economic moat." It’s the durable competitive advantage that protects a company from its rivals, just as a moat once protected a castle. Finding companies with wide moats is the key to unearthing businesses that can prosper for years, even decades.
In the Indian context, these moats can appear in several forms:
Strong Brand: Think of names like Tata or Asian Paints. The trust and recognition they command have been built over generations, creating a powerful moat.
Distribution Network: Companies like Hindustan Unilever (HUL) have an incredible distribution network that reaches nearly every nook and cranny of the country. This creates a massive barrier to entry for any potential competitor.
Low-Cost Production: A business that can produce its goods more cheaply than its rivals, like certain companies in the generic pharmaceutical sector, holds a powerful and lasting advantage.
Your Fundamental Analysis Checklist
Knowing the theory is one thing, but having a repeatable process is what truly separates successful investors from the rest. To consistently and thoroughly analyse Indian stocks, you need a structured workflow. This checklist pulls together everything we've discussed into a practical framework.
Think of it as your pre-flight check before any investment. It’s designed to help you stay disciplined, avoid common analytical traps, and ensure you’ve covered all the critical bases before putting your hard-earned capital on the line.
The Business and Its Environment
Before you even glance at a financial statement, you need to understand the bigger picture. The goal here is to get a feel for the company's identity and the world it lives in.
Understand the Business Model: First things first, how does this company actually make money? What exactly are they selling, and who is buying it? If you can't explain this simply, move on.
Analyse the Industry: Now zoom out. Is the industry itself expanding, stagnating, or even shrinking? Pinpoint the major trends, technological shifts, and competitive pressures that affect every company in this space.
Evaluate the Economic Moat: What gives this company its edge? What's its sustainable competitive advantage? It could be a beloved brand, an unbeatable cost structure, or a powerful distribution network that no one can easily replicate.
Once you understand the story, it's time to see if the numbers back it up. This is where you test the narrative against the hard data of the company's financial health.
Financial Statement Review: Dig into the Profit & Loss Statement, Balance Sheet, and Cash Flow Statement for at least the last five years. You’re looking for patterns—things like consistent revenue growth, stable profit margins, and, most importantly, positive cash flow from operations.
Key Ratio Analysis: Calculate the vital signs. How does its Return on Equity (ROE) and Debt-to-Equity (D/E) ratio stack up against its closest competitors? Is its Price-to-Earnings (P/E) ratio reasonable for its industry?
Valuation Assessment: It's time to estimate what the business is actually worth. Start with a simple relative valuation by comparing its P/E to its peers. If you're comfortable, try a basic Discounted Cash Flow (DCF) model to get a rough idea of its intrinsic value.
Qualitative Analysis: The Human Element
Finally, look beyond the spreadsheets. Some of the most critical factors for long-term success can't be found in a financial report. This is where judgement and experience come in.
Management Quality: Who is running the show? Research the background of the leadership team. You're looking for integrity, a clear vision for the future, and a history of making smart decisions with the company's money.
Corporate Governance: In the Indian market, this is non-negotiable. Check for clear and transparent reporting, policies that respect minority shareholders, and a history that is free from major scandals or controversies. Red flags here are a deal-breaker.
Getting started with the fundamental analysis of Indian stocks can feel a bit overwhelming. Let's tackle some of the most common questions that pop up for new investors, hopefully clearing the path for you.
How Long Does a Proper Analysis Take?
When you're just starting, a deep dive into a single company can easily take several hours, sometimes spread over a few days. You'll be poring over annual reports, getting familiar with financial statements, running the numbers on key ratios, and understanding the industry the company operates in.
As you get more practice under your belt, you'll naturally get faster. But don't fall into the trap of rushing it. The real aim isn't just to check a box; it's to genuinely understand the business inside and out.
Where Can I Find Reliable Financial Data?
Good analysis is built on a foundation of trustworthy information. For Indian companies, your best bets are:
Company Websites: Head straight to the "Investor Relations" section. This is where you'll find the gold—annual reports, quarterly updates, and official presentations.
Stock Exchanges: All publicly listed companies have to file their documents with the exchanges. You can find everything on the official websites for the Bombay Stock Exchange (BSE) and the National Stock Exchange (NSE).
Financial Portals: Websites like Moneycontrol, Screener.in, and Tijori Finance are fantastic. They pull all this data into one place and often give you easy-to-use tools and ready-made ratios to kickstart your research.
You absolutely can. An investment strategy built purely on fundamentals is a time-tested approach for building long-term wealth. It's the method championed by legendary investors like Warren Buffett, and it's all about finding great businesses trading at sensible prices.
That said, many sharp investors like to mix things up. They use fundamental analysis to decide what to buy and then layer on technical analysis to help them figure out when to buy. It’s a powerful combination.
Ready to put this knowledge to the test? At Unlisted Shares India, we offer clear and direct access to high-potential unlisted shares, backed by the data you need to make smart choices. Come explore our platform and find your next great investment. Learn more at Unlisted Shares India.
Share:
Our Blogs
Our blog provides insightful information about unlisted shares, offering a deeper understanding of how these assets work, their potential benefits, and the risks involved. Whether you're new to unlisted shares or looking to expand your knowledge, we cover topics such as investment strategies, valuation methods, market trends, and regulatory aspects. Stay updated with expert tips and guides to navigate the unlisted share market effectively.