Technical vs Fundamental Analysis The Ultimate Guide
7 July 2025
16 min read
At its heart, the difference between technical vs fundamental analysis comes down to what you choose to focus on. Technical analysis is all about studying price charts and market data to predict future trends. Fundamental analysis, on the other hand, is about digging into a company's financial health to figure out its actual worth.
Think of it this way: a technical analyst is like a seasoned sea captain reading the waves and winds to predict the immediate journey, while a fundamental analyst is like a marine biologist studying the ocean's ecosystem to understand its long-term health. This core distinction shapes everything an investor does.
Choosing Your Investment Philosophy
Deciding whether to lean towards technical or fundamental analysis is a foundational step in shaping how you approach the market. Each methodology offers a completely different way of seeing potential investments, influencing not just what you buy, but also when you buy it and why. Your choice really comes down to your personal goals, how much time you can commit, and even your own personality.
Fundamental analysis is the art of calculating a company's true value, often called its intrinsic value. This means rolling up your sleeves and diving deep into financial statements, assessing the quality of the management team, understanding its competitive edge, and even looking at the broader economic environment. The goal here is simple: find great companies that are currently undervalued by the market. This makes it a go-to strategy for long-term, value-focused investors.
Technical analysis operates on a different assumption altogether: that all the important information is already baked into a stock's price. Practitioners pore over historical price charts, trading volumes, and specific patterns to forecast where the price is headed next. It’s a game of market psychology and timing, which is why it’s so popular with short-term traders who need to nail their entry and exit points.
A Direct Comparison of Core Principles
To make the differences crystal clear, let's lay them out side-by-side. Seeing the foundational principles in a simple table can help you quickly understand the opposing mindsets behind each approach. For anyone just starting out, getting a firm grip on these concepts is a vital part of a broader education in stock market investing.
Criterion
Fundamental Analysis
Technical Analysis
Primary Goal
Determine a company's intrinsic value.
Predict future price movements.
Time Horizon
Long-term (months to years).
Short-term (days to weeks).
Core Tools
Financial statements, economic data.
Price charts, technical indicators.
Key Question
"What is this company worth?"
"Where is the price going next?"
In reality, many of the most successful investors don't strictly pick one side. They often blend both methods to get a more robust view. For more perspectives and a variety of articles on investment strategies, you might find useful insights on blogs like yieldseeker's Investment Blog. A balanced approach can give you a much more complete picture before you put your money to work.
The Core of Fundamental Analysis
If you're a long-term value investor, fundamental analysis is your playbook. Forget the daily noise of stock price charts; this approach is all about getting to the heart of a company's intrinsic worth. Think of it less like trading stocks and more like becoming a part-owner of a business. It requires you to roll up your sleeves and do a thorough investigation into a company's financial health, the quality of its management, and where it stands against its competition.
At its core, fundamental analysis is a deep dive into a company's financial statements. Analysts pore over income statements to understand profitability, dissect balance sheets to weigh assets against liabilities, and track cash flow statements to see how money moves through the business. The ultimate aim is to build a complete, unvarnished picture of a company's operational strength and long-term stability.
Key Metrics for Valuation
So, how do you figure out if a company is actually a good investment? Fundamental analysts lean on several key metrics. These ratios act as a standardised toolkit, allowing you to compare a company not just against its rivals but also against its own past performance.
Here are a few of the most common metrics you'll encounter:
Price-to-Earnings (P/E) Ratio: This classic metric compares a company's share price to its earnings per share. It gives you a quick snapshot of whether a stock might be overvalued or undervalued compared to its profit-generating power.
Book Value: This figure represents the company's net asset value, calculated as its total assets minus any intangible assets and liabilities. In simple terms, it's a measure of the company's tangible worth.
Dividend Yield: This shows how much a company pays its shareholders in dividends each year relative to its stock price. A steady, reliable dividend is often a sign of a stable, mature business.
Beyond the Numbers
While the numbers provide the foundation, it's the qualitative factors that add the crucial context. These elements often become the deciding factor when making an investment decision.
Key qualitative aspects to consider include:
Management Effectiveness: You need to assess the leadership team. What's their track record? Do they have a clear, compelling vision for the future?
Competitive Advantage: Does the company have an "economic moat"? This could be strong brand recognition, valuable patents, or a lower cost of production that protects it from competitors.
Industry Conditions: It's vital to understand the broader trends and challenges shaping the company's entire sector.
The Mechanics of Technical Analysis
Where fundamental analysis dives into a company's financial health, technical analysis is all about timing the market. It’s the go-to discipline for active traders who operate on a simple, powerful belief: all known information, from earnings reports to broad market sentiment, is already baked into a stock’s price. The core idea is that prices don't move randomly; they follow trends and form recognisable patterns that can help forecast what's coming next.
Technical analysis doesn't ask why a price is moving. It only cares about where it might be headed. Think of it as a pure study of supply and demand, visualised on a chart. For traders, this is how they pinpoint the best moments to get in or out, manage their risk with precision, and profit from short-term market psychology.
Core Tools of the Trade
Technical analysts have a whole arsenal of tools to read the story a chart is telling. These instruments help them cut through the daily noise to spot potential trading opportunities. While you could spend a lifetime mastering them all, a few key tools form the bedrock of almost every technical strategy.
Some of the most popular tools include:
Chart Patterns: These are distinct shapes that appear on price charts, which many believe can signal where the price is going. You've probably heard of the "head and shoulders," a classic sign of a trend reversal, or "triangles," which might signal the current trend is about to continue or reverse.
Candlestick Signals: Every single candlestick on a chart tells a miniature story about the battle between buyers and sellers in a given timeframe. Patterns like a "doji" or a "hammer" can provide powerful clues about market indecision or signal that a turning point is near.
Support and Resistance Levels: These are price zones where a stock has historically struggled to fall below (support) or rise above (resistance). Nailing these levels is absolutely crucial for setting smart entry points and protective stop-loss orders.
Beyond just looking at visual patterns, traders use mathematical indicators to get another layer of insight. These are formulas based on a stock's price, volume, or both, plotted right onto a chart to generate objective trading signals.
Two of the most trusted indicators you'll come across are:
Relative Strength Index (RSI): This is a momentum oscillator that measures how quickly prices are changing. A reading above 70 is generally seen as overbought (and possibly due for a pullback), while a reading below 30 is considered oversold (and may be due for a bounce).
Moving Average Convergence Divergence (MACD): The MACD is a classic trend-following momentum indicator. It shows the relationship between two moving averages of a stock's price, and traders watch for crossovers between the MACD line and its "signal line" to spot potential buy or sell signals.
In the lively Indian equity markets, these tools carry significant weight. A huge percentage of active traders on the NSE rely heavily on technical analysis, with candlestick patterns, the MACD, and support/resistance levels being their most-used methods. Indian traders often use these techniques to try and capitalise on the short-term volatility that comes with local events, like RBI policy announcements or quarterly earnings surprises. You can see more on how investors in India navigate market fluctuations with strategic technical analysis.
By getting a grip on these mechanics, any trader can start building a more systematic approach to spotting opportunities and, just as importantly, managing risk.
Two Sides of the Same Coin: A Head-to-Head Comparison
When you put technical and fundamental analysis under the microscope, their differences aren't just about the tools you use—it's about two completely different mindsets for looking at the market. Forget a simple pros and cons list. To truly understand which path is for you, we need to compare them on what really matters: your goals, your timeline, and the information you trust.
The whole debate boils down to a few core questions. Are you trying to find a great business or just predict a stock's next move? Do you think in years or in minutes? These practical distinctions will shape every single decision you make as an investor or trader.
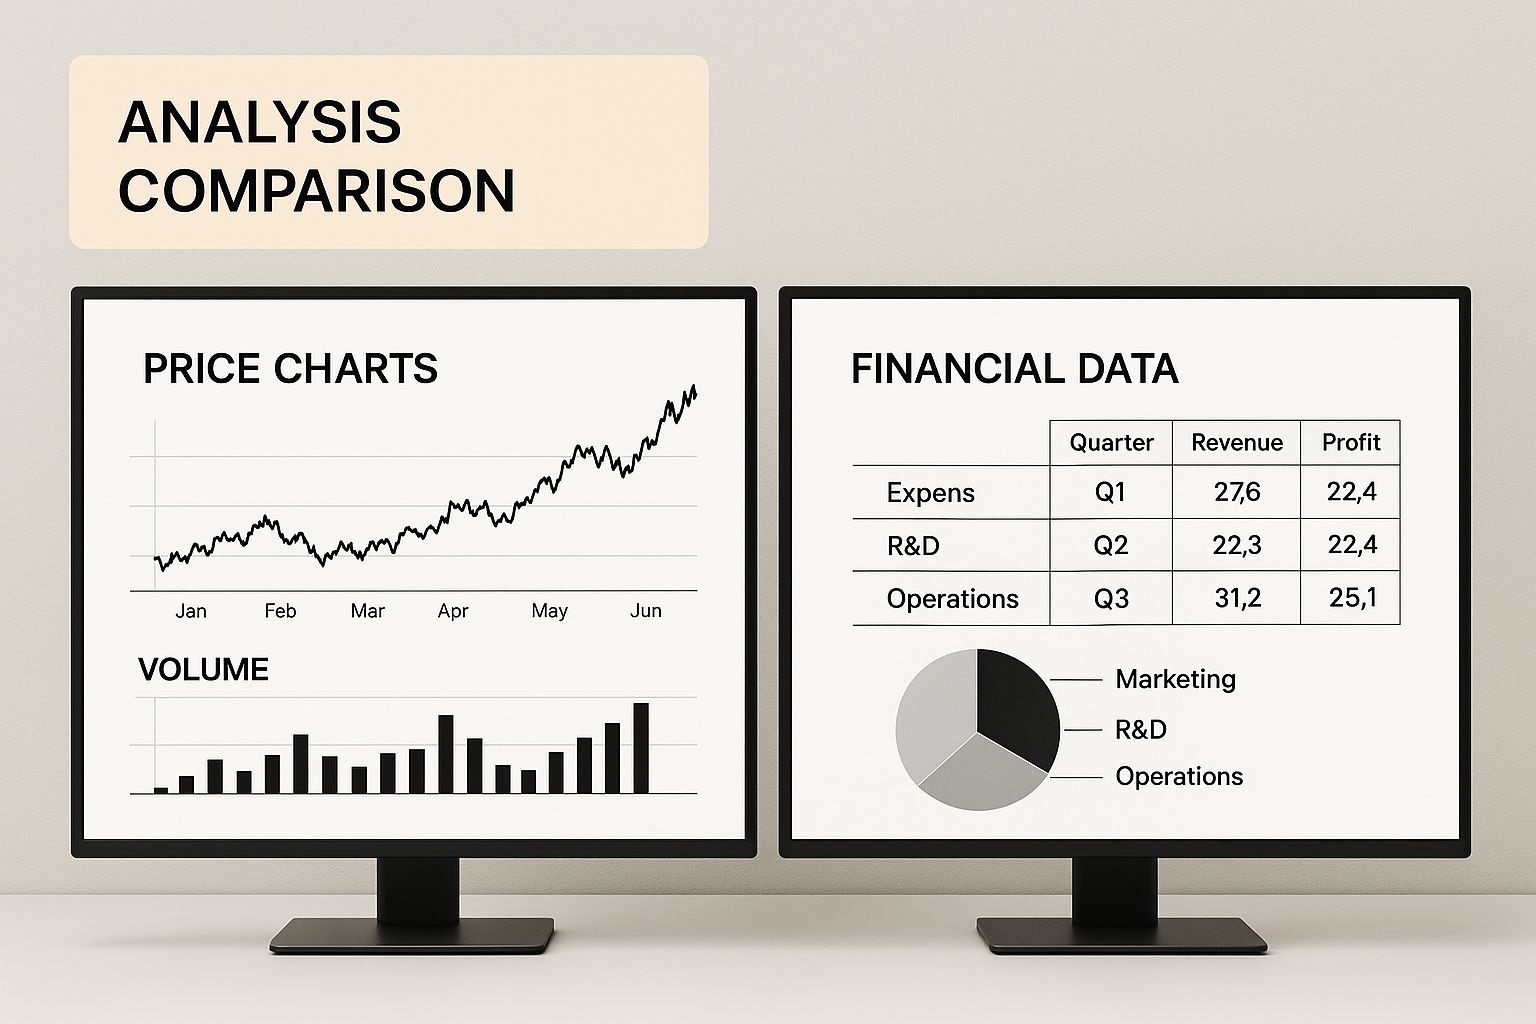
This image perfectly captures the two worlds: one analyst poring over financial statements, the other decoding patterns on a price chart.
It’s this split in data—the "what" you analyse—that forms the most obvious dividing line between the two disciplines.
The Primary Goal: What Are You Actually Trying to Do?
The biggest difference lies in the objective. Fundamental analysis is all about a hunt for intrinsic value. You're asking, "Setting the current share price aside, what is this company genuinely worth?" Every step, from digging into a balance sheet to judging the leadership team, is geared towards finding that one number.
Technical analysis, on the other hand, couldn't care less about intrinsic value. Its sole purpose is predicting where the price is headed next. Technicians operate on the belief that all the fundamental data—earnings, debt, management changes—is already baked into the current price. Their job is to ask, "Given how this stock has behaved in the past, where is it likely to go?"
The Time Horizon: Are You in It for the Long Haul or a Quick Win?
How long you plan to hold an asset is a huge factor in choosing your method. Fundamental analysis is a long-term game, plain and simple. Finding a brilliant but undervalued company and waiting for the rest of the market to catch on can take months, and more often, several years. It's the patient approach for building wealth over a lifetime.
By contrast, technical analysis is built for speed. It’s the go-to toolkit for day traders and swing traders who need to make decisions in a flash. Their entire focus is on exploiting price swings that unfold over minutes, hours, days, or maybe a few weeks. Spending days analysing a decade of annual reports just isn’t practical when your trade might last less than a day.
The Data Sources: Where Do You Look for Answers?
This is where the two methodologies truly part ways, drawing from completely separate pools of information. One looks at the business, the other at the market's reaction to it.
To make the distinction crystal clear, let's break it down.
Technical vs Fundamental Analysis: A Practical Comparison
This table neatly summarises the core philosophies, tools, and data that define each approach.
Criterion
Fundamental Analysis
Technical Analysis
Core Philosophy
The market can get a company's price wrong in the short term, but it will eventually correct to its true value.
All known information is already factored into the stock price. Prices move in trends and recurring patterns.
Primary Data Source
Financial statements (income, balance sheet, cash flow), economic data, and deep industry research.
Price and volume charts, historical market data, and indicators derived from that data (e.g., moving averages).
Key Metrics
P/E ratio, dividend yield, debt-to-equity, earnings per share (EPS), return on equity (ROE).
Moving Averages, Relative Strength Index (RSI), MACD, support/resistance levels, and chart patterns.
As you can see, while both camps are aiming for profit, they take fundamentally different roads to get there. One looks "under the bonnet" to inspect the engine of the business, while the other studies the psychology of the drivers on the road. Grasping this core difference is your first step to building a strategy that truly works for you.
How to Combine Both Strategies
The old debate of technical vs. fundamental analysis often paints them as rivals, pushing investors to pick a side. In my experience, the sharpest investors don't play that game. They know that these two disciplines aren't at odds with each other; in fact, they’re incredibly powerful when used in tandem.
Think of it this way: combining them helps you build a more complete, robust investment system. By weaving together the strengths of both, you get a real edge. You move beyond just finding good companies to buying them at the right moment. It's this synergy that creates a truly effective decision-making framework.
The "What" and "When" Strategy
One of the most practical ways to blend these approaches is a two-step process that tackles the two most important questions every investor faces: "what to buy" and "when to buy." This method lets each type of analysis do what it does best, giving you a logical and repeatable workflow.
First, you lean on fundamental analysis to figure out what to buy. This is the deep-dive work—poring over financial statements, assessing competitive advantages, vetting the management team, and understanding growth prospects. The goal here is to create a watchlist of high-quality businesses you’d genuinely want to own for the long haul, based purely on their underlying value.
Then, you turn to technical analysis to decide when to buy. Once a fundamentally sound company makes your watchlist, you shift your focus to its price chart. Instead of jumping in right away, you patiently wait for a favourable technical signal. This could be a price breakout above a stubborn resistance level or a solid bounce from a long-term support zone. This step is crucial for avoiding the classic mistake of buying a great company while its stock is still stuck in a downtrend.
This integrated approach isn't just for buying; it works just as well for selling. A fundamental red flag—like deteriorating financials or a competitor eroding its market share—might tell you it's time to think about selling. Technical analysis can then help you pinpoint a smart exit, like a break below a key moving average, helping you lock in your gains.
A Real-World Example in Action
Let's walk through a scenario. Imagine you're researching a company in the chemical sector. Your fundamental homework shows it has consistently growing revenues, a healthy low debt-to-equity ratio, and just secured a major patent that strengthens its competitive position—a strong "economic moat." The business looks like a fantastic long-term investment, but its stock price has been stagnant for months.
Here’s how you’d apply the combined strategy:
Fundamental Screening: The company’s fundamentals are excellent, so you add it to your watchlist. You've figured out what you want to buy.
Technical Monitoring: Now, you become a chart-watcher. You notice the stock has been trading sideways in a tight range, forming what chartists call a "consolidation" pattern.
The Entry Trigger: After a few weeks, the stock price decisively breaks out above the top of this range, and it does so on high trading volume. This technical signal is the market's way of saying sentiment is shifting, and the stock looks ready to climb.
Execution: With both fundamental quality and technical momentum pointing in the same direction, you confidently place your buy order.
Finding Your Personal Investing Style
So, you understand the theory behind technical vs fundamental analysis, but how do you actually use it? It all starts with a bit of self-reflection. There isn't a magical "best" method that works for everyone. The right strategy for you is one that genuinely fits your financial goals, how much risk you're comfortable with, and—crucially—how much time you can realistically spend on investing.
Think of it this way: your personal investing style is what turns abstract knowledge into real-world profits.
First, figure out what kind of investor you are. Are you in it for the long haul, patiently building wealth over the next 10, 20, or 30 years? If that sounds like you, then the deep-dive approach of fundamental analysis is your natural starting point. This path means you’ll learn to think like a business owner, scrutinising a company's financial health and long-term prospects instead of getting caught up in daily market noise.
The Active Trader vs The Long-Term Investor
What if you're the opposite? If you're an active trader looking to make quick gains from market momentum, then technical analysis is your essential toolkit. Your world will revolve around chart patterns, indicators, and nailing the timing of your entries and exits. Be warned, though—this style requires constant vigilance and a very steady hand, as you'll be making decisions in hours or even minutes.
The reality is, most of us fall somewhere in between. For this majority, a hybrid approach often works wonders. It allows you to use the strengths of both methods: fundamental analysis to pick solid, well-run companies, and technical analysis to figure out the best time to buy or sell. This powerful combination can help you avoid the classic mistake of buying a great company at a terrible price.
Building Your Framework for Success
No matter which direction you lean, a solid foundation is essential. This means committing to continuous learning and understanding the bigger picture of how wealth is created. If you're just starting out, our guide on how to start investing offers a practical, step-by-step roadmap.
A truly robust investing style also goes beyond just charts and balance sheets. It's built on strong financial literacy. You can get a huge head start by exploring the wisdom in some of the best personal finance books, which offer timeless advice on managing money and thinking long-term.
In the end, whether you become a fundamentalist, a technician, or a bit of both, consistency is what matters most. Set your rules, stick to your plan, and be willing to adapt as you gain more experience. This disciplined approach is what will give you the confidence to navigate the markets and turn your hard-earned knowledge into tangible results.
Frequently Asked Questions
Here are answers to some common questions we get about the ongoing debate between technical and fundamental analysis.
Can Beginners Use Fundamental Analysis?
Absolutely. While the deep end of fundamental analysis can involve complex financial modelling, the core principle is something anyone can grasp: get to know the business you're putting your money into. That’s a fantastic starting point for any new investor.
A great way to begin is by simply reading a company's annual report. You don't need to be a financial wizard. Just focus on the business description and the CEO's letter to shareholders. This will give you a real feel for the company's vision, its market, and the hurdles it faces.
Instead of getting bogged down in valuation formulas, start by asking some simple, powerful questions:
Has the company consistently grown its sales and profits over the years?
Does it have a brand people trust or a product they can't do without?
How does its debt compare to its main rivals?
Is Technical or Fundamental Analysis Better for Unlisted Shares?
When it comes to unlisted shares, fundamental analysis isn't just better—it's essential. Technical analysis lives and dies by historical price charts and trading volume data. For private companies that aren't traded on a public stock exchange, this data is either completely missing or far too thin to be useful. You can't analyse a chart that doesn't exist.
Investors in the private market have to think more like business owners than traders. The focus shifts entirely to the company's core fundamentals:
Digging into the company's financial health and its potential for growth.
Scrutinising the management team's experience and their past successes (or failures).
Understanding where the company stands against its competitors in the industry.
Which Analysis Is More Difficult to Learn?
Honestly, both take a lot of time and dedication to master, but they challenge you in different ways.
Fundamental analysis often feels more intellectually heavy at the start. It requires you to get comfortable with accounting principles, financial concepts, and business strategy. It’s also a significant time commitment, demanding hours of research into dense financial reports and broad industry trends.
On the other hand, technical analysis can seem easier to pick up because it's so visual. You're looking at charts and patterns, which feels intuitive. The real difficulty, however, is a hidden one. Mastering technicals requires incredible discipline, emotional detachment, and the ability to read subtle signals while managing risk in real-time. For many traders, the psychological battle is the toughest part of the journey.
Ready to explore high-potential unlisted shares with confidence? Unlisted Shares India provides the transparent data and expert insights you need to make informed investment decisions based on solid fundamental analysis. Discover unique opportunities on https://unlistedsharesindia.com.
Share:
Our Blogs
Our blog provides insightful information about unlisted shares, offering a deeper understanding of how these assets work, their potential benefits, and the risks involved. Whether you're new to unlisted shares or looking to expand your knowledge, we cover topics such as investment strategies, valuation methods, market trends, and regulatory aspects. Stay updated with expert tips and guides to navigate the unlisted share market effectively.